| Author | Ayad, Hiba Anis |
| Author | Al-Obadi, Muna Abdulrahman |
| Author | Al-Kilani, Lana Ala' |
| Author | Hussein, Haneen Tawfiq |
| Author | Arshad, Raiha |
| Author | Kucukvar, Murat |
| Available date | 2020-10-22T07:00:23Z |
| Publication Date | 2020 |
| Publication Name | Qatar University Annual Research Forum & Exhibition 2020 |
| Citation | Ayad H.A., AlObadi M.A., AlKilani L.A., Hussein H.T., Arshad Ra., Kucukvar M., "Developing an Interactive Data Visualization Platform to Present the Adaption of Electrical Vehicles in Washington, California and New York", Qatar University Annual Research Forum and Exhibition (QUARFE 2020), Doha, 2020, https://doi.org/10.29117/quarfe.2020.0072 |
| URI | https://doi.org/10.29117/quarfe.2020.0072 |
| URI | http://hdl.handle.net/10576/16607 |
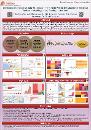
| Abstract | This paper is an overview of using data visualization tools to provide a better insight into a large amount of data and represent the data in a visualized form. The used data is related to Electric Vehicles (EV) usage in three different states in the USA which are California, New York, and Washington. the data collected from reliable resources to assure the reliability and accuracy of the results, then compiled as a Microsoft Excel workbook which used as a data recourse in Microsoft Power BI. By visualizing the data we will end up with rich visuals which will clarify the data for the end-user. After analyzing the data, a clear vision created and recommendations have been suggested. |
| Language | en |
| Publisher | Qatar University Press |
| Subject | Data visualization; Electric Vehicles; Microsoft Power PI; Sustainability; USA.
|
| Title | Developing an Interactive Data Visualization Platform to Present the Adaption of Electrical Vehicles in Washington, California and New York |
| Type | Poster |
|
dc.accessType
| Open Access |