

Search
Now showing items 1-6 of 6
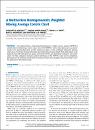
A Multivariate Homogeneously Weighted Moving Average Control Chart
(
Institute of Electrical and Electronics Engineers Inc.
, 2019 , Article)
This paper presents a multivariate homogeneously weighted moving average (MHWMA) control chart for monitoring a process mean vector. The MHWMA control chart statistic gives a specific weight to the current observation, and ...
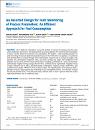
An Assorted Design for Joint Monitoring of Process Parameters: An Efficient Approach for Fuel Consumption
(
Institute of Electrical and Electronics Engineers Inc.
, 2019 , Article)
Due to high fuel consumption, we face the problem of not only the increased cost, but it also affects greenhouse gas emission. This paper presents an assorted approach for monitoring fuel consumption in trucks with the ...
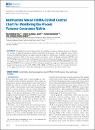
Multivariate Mixed EWMA-CUSUM Control Chart for Monitoring the Process Variance-Covariance Matrix
(
Institute of Electrical and Electronics Engineers Inc.
, 2019 , Article)
The dispersion control charts monitor the variability of a process that may increase or decrease. An increase in dispersion parameter implies deterioration in the process for an assignable cause, while a decrease in ...
Efficient cv control charts based on ranked set sampling
(
Institute of Electrical and Electronics Engineers Inc.
, 2019 , Article)
Monitoring process variability is essential for establishing efficient process-control schemes. In practice, when the mean levels of a parameter are constant, and the process variance (or standard deviation) is independent ...
An enhanced nonparametric EWMA sign control chart using sequential mechanism
(
Public Library of Science
, 2019 , Article)
Control charts play a significant role to monitor the performance of a process. Nonparametric control charts are helpful when the probability model of the process output is not known. In such cases, the sampling mechanism ...
Phase II monitoring of linear profiles with random explanatory variable under Bayesian framework
(
Elsevier
, 2019 , Article)
Linear profiles monitoring have been successfully implemented in many industrial applications. The design structures of control charts for profiles monitoring are mostly based on two major classifications namely Classical ...